Last updated: 12 Feb 2026
The energy efficiency of new build homes
The home building industry is adapting at pace to support the country’s net zero targets and deliver increasingly energy and thermal efficient homes.
In 2022, the Home Builders Federation released its first
'Watt a Save' report comparing the energy performance of new build homes with older properties.
We continue to examine the energy efficiency of new build homes, with our latest research published in February 2026.
Quick links
Latest figures Previous reports Key messages Designed assetsBecome a member of HBF
Find out how we can support your organisation with key issues.
The latest energy efficiency figures
Last updated: Febraury 2026
With the move to the electrification of new build properties, it has become more complex to track bills based on energy usage and unregulated energy. As such, the below now quantifies the savings new builds offer with respect to regulated energy – heating, hot water and lighting.
Calculations are taken from HBF and Octopus Energy Watt a Save report, using data from EPC registrations of new and existing properties in the year to December 2025.
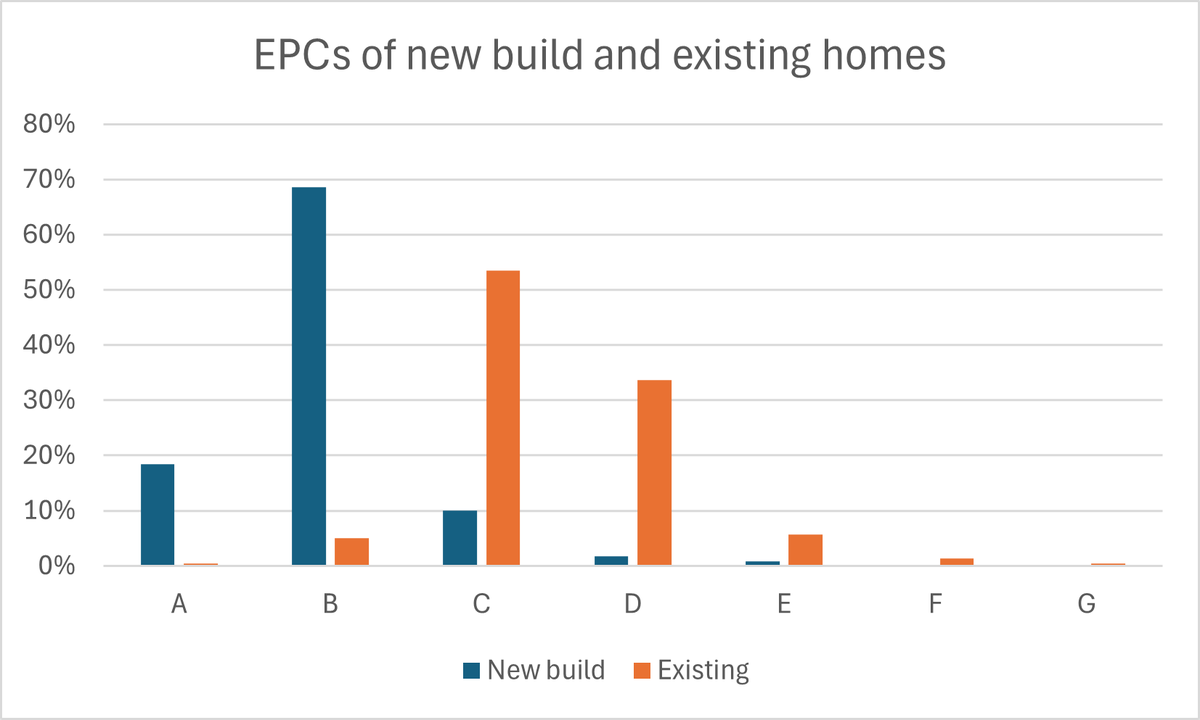
87% of new builds have an A or B EPC rating
New build homes are increasingly more energy efficient. Less than 5% of existing older properties achieve an A or B Energy Performance Certificate rating (EPC).
New build homes emit up to 74% less carbon a year
The average new build home, which is rated EPC A or B, emits 2,179g of carbon per year, while older homes rated EPC F and G produce around 50% more at 3,266kg a year.
Making energy costs up to 27% cheaper
The average new build house owner will pay just over £1,574 a year to run, compared to £2,192 for those in older properties rated EPC G or F. This is a yearly saving of £618.
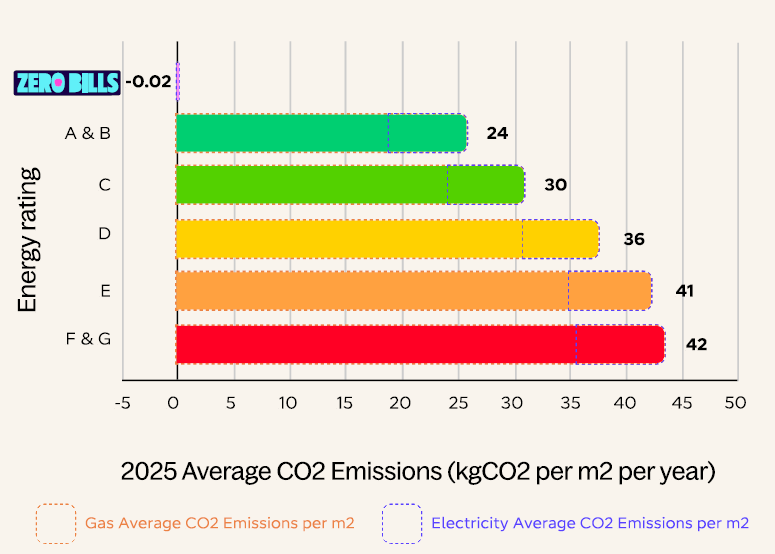
Average carbon savings
On average, new build homes emit up to 74% less carbon than older properties, reducing annual emissions by around 1,080kg per home.
EPC A or B rated new build homes produce roughly 2,179kg of carbon per year, compared with around 3,266kg for EPC D homes and up to 3,787kg for the least efficient F or G rated properties.
Energy bill savings in new build homes
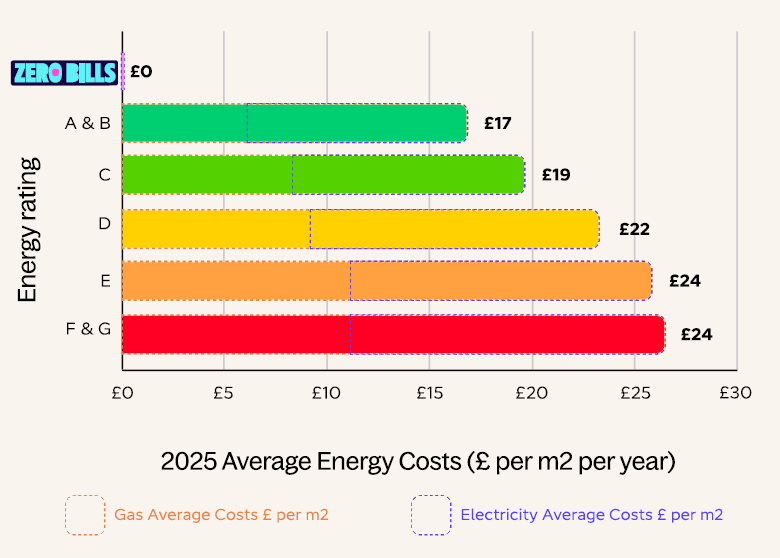
Average energy costs
On average, new build homeowners could save around £420 a year on energy bills compared with those living in older properties, with annual energy costs of about £1,574 versus £1,995. This means new build homes are around 21% cheaper to run, delivering consistent savings on energy bills
The potential savings increase further when comparing the EPC ratings of new builds to the least efficient properties. Nearly all new-build homes achieve an A or B EPC rating, making the average new build 39% cheaper to run, at around £618 a year less than an older home with an F or G EPC rating.
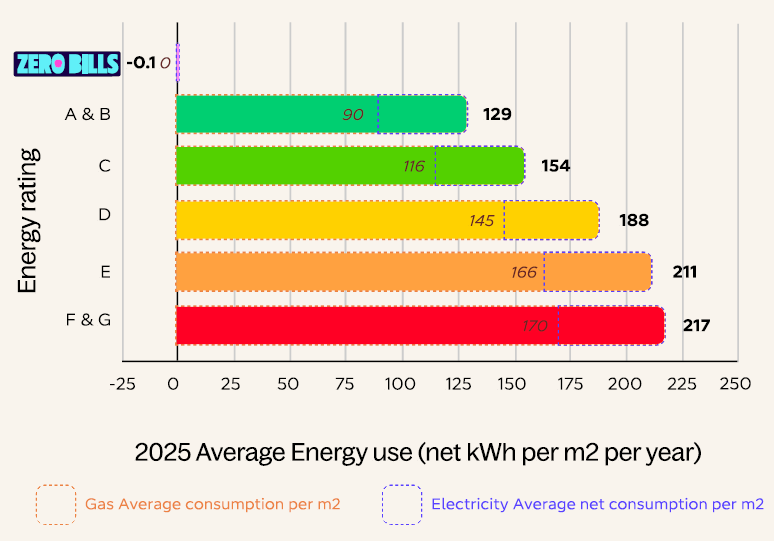
Average energy use
On average, households living in A or B rated homes use significantly less energy than those in less efficient properties.
An average 90m² A or B rated home consumes around 11,599 kWh of gas and electricity per year, compared with 16,896 kWh for a D rated home and 19,540 kWh for F or G rated properties. This makes A and B rated homes around 46–68% more efficient than older, less efficient homes.
The energy use gap is even more pronounced for gas, with D rated homes using 61% more and F or G rated homes using 88% more than A or B rated homes. This demonstrates the clear efficiency advantage of higher-rated properties.
Some homes, like “Zero Bills” properties, can even generate more energy than they consume, highlighting the potential for homes to not only reduce costs but also contribute to net-zero energy goals.
EPC ratings data
EPCs of new build and existing homes in the year to December 2025
85% of new build homes achieved the highest levels of energy performance (A or B EPC) compared with less than 5% of older homes.
Calculations are based on Government's EPC registrations data of new and existing properties in the year to December 2025.
Watt a Save reports
Published in February 2026 in partnership with Octopus Energy, HBF's latest research has revealed that modern, energy-efficient new build homes offer significant cost savings and major reductions in household carbon emissions compared to older properties.
On average, households living in new build homes benefit from significantly lower energy costs, saving around £420 a year compared to those living in older properties. New-build homeowners spend on average around £1,574 per year on energy, while homeowners in older homes pay closer to £1995, making new build homes 21% cheaper to run.
View the reportHBF's July 2023 Watt a Save report found new build homebuyers were saving over £400 million a year in energy bills, as well as collectively reducing carbon emissions by over 500,000 tonnes.
Download reportOur February 2023 Watt a Save Report found new build properties are significantly more environmentally friendly than older equivalent properties, emitting just 1.4 tonnes of carbon a year, compared to the 3.6 tonnes that existing properties emit.
Download the reportOur first Watt a Save report found new build home buyers were saving an average of more than £2,000 on household bills per property each year, equivalent to £173 a month. For buyers of houses, as opposed to flats the savings were even greater at £220 per month.
Download the reportMember resources
Restricted Content
Key messages
Our key messages are available to HBF members. Please sign in to view or visit our membership page for more information on joining HBF.
LoginJoin the Home Builders Federation
Access exclusive HBF member only events and receive discounts on our conferences.