Last updated: 29 Sep 2025
Analysing Exchequer returns from the Help to Buy scheme
Contents
Summary
The Help to Buy: Equity Loan Scheme was introduced in 2013 as the lack of suitable mortgage finance had seen housing supply fall to its lowest ever peacetime level during 2012/13 even amidst generally improving economic conditions.
Investment in new sites increased rapidly in the months and years following the scheme’s introduction. By 2019/20, net housing supply had doubled to around 250,000 homes per year, far outstripping the figures seen during the new housing booms of the 1950s and 1960s.
Compared with historic government home ownership interventions, it is the only significant initiative that generated a substantial positive supply-side impact. Only two previous interventions are comparable:
the Mortgage Interest Relief at Source (MIRAS) regime which was a purely credit-based intervention and involved a multi-billion pounds per year subsidy even in 1980s prices. MIRAS assisted millions of households but only supported demand for housing; and
the Right to Buy which was a stock tenure transfer initiative, simply switching homes from being council-owned to owner occupation. The Right to Buy supported more than a million households to purchase their council homes.
Following the introduction of Help to Buy in April 2013:
Supported almost 400,000 buyers to buy an energy efficient new build home, including just under a third of a million first-time buyer households;
Created an unparalleled period of housing supply growth following investment from builders who were given confidence over future demand for new homes;
Has seen 154,275 households fully pay off their government equity loans;
Has so far generated a net return on investment of £718m for the Exchequer to date (+9% against original value of loans) in addition to more £220m in interest payments.
In 2013, Help to Buy was designed with new regulations governing mortgage lenders’ capital risk weightings in mind. By giving buyers access to 75% LTV mortgages, lenders could assign lower risk weight to the loans and set the mortgage rate accordingly. Buyers would only require a 5% deposit and take out smaller mortgages, benefit from the lower rates that come with them.
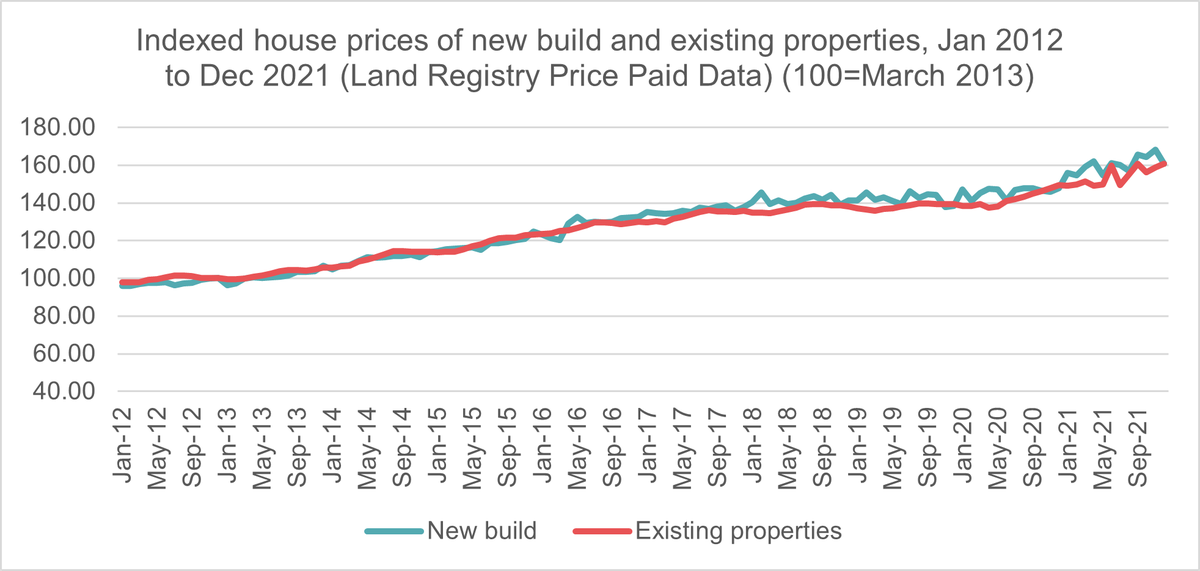
Arguments that the scheme creates excessive house price inflation are unevidenced. While new homes do typically cost more than older, less efficient properties, average new home prices have risen entirely in line with existing properties during the decade in which Help to Buy was in operation.
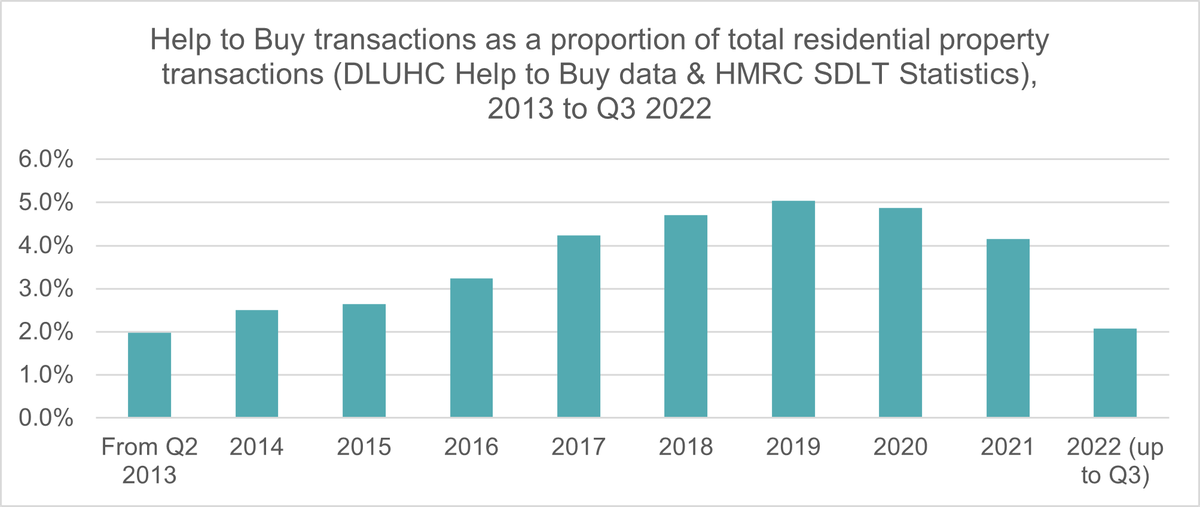
At its peak, Help to Buy still only accounted for 5% of total housing market transactions so the case for this subset of activity driving the inflation of the entire housing market seems implausible.
Help to Buy, what preceded it and the scheme’s performance
Home ownership schemes before Help to Buy
The Help to Buy scheme followed a series of initiatives from different governments aimed at supporting first-time buyers onto the housing ladder and into new build homes. Policy interventions to promote and support home ownership had been a feature of the policy landscape and the housing market from the 1960s up to 2023.
During the 20th Century, the focus of these initiatives was largely focused on tax reliefs for mortgage payers. In 1967, Government introduced the Option Mortgage Scheme. The scheme gave homebuyers the choice of either tax relief on mortgage interest payments or a Government subsidy to reduce the interest rate on the mortgage. This was intended to support households who did not pay tax and would be unable to benefit from more common tax relief schemes.
In 1978, Government introduced Mortgage Interest Relief at Source (MIRAS). For a time Dual MIRAS allowed two homeowners to claim double relief. By 1985/86, the scheme came at a cost of £4.75bn per year (Hansard, 12 May 1986: Col. 341). This is equivalent to around £15bn per year in 2024 prices.
The Right to Buy was an exception to the 20th Century orthodoxy around mortgage interest reliefs with a major government drive to discount council homes for tenants. With more than one million such transactions, the Right to Buy can be seen as the UK policy intervention that created the biggest surge in home ownership, but with no supply-side component the scheme merely saw the transfer of a large proportion of housing stock from one tenure (social rented) to another (owner occupation).
With this experience in mind and with a growing understanding of the emerging housing supply and affordability crises, around the turn of the millennium attention turned to directing home ownership support to delivery of new housing. Assisting first-time buyers and key workers onto the housing ladder would also help to stimulate housing supply by addressing the lack of higher loan-to-value mortgage lending on new build housing. The dearth of high LTV mortgages for new properties was exacerbated by a planning policy that promoted delivery of apartments over houses but with restricted mortgages available for new apartments.
The 2000s saw the focus turn to supporting first-time buyers to purchase new build homes with Government seeking to tie home ownership to economic growth and regeneration while guarding against pure demand-side stimuli. Indeed, it was during this time that the already significantly scaled down MIRAS was phased out.
The problem being solved by the 2000s was the discrimination against new build lending in the mortgage sector and a desire from the government of the day to increase home building rates. In short, the reliance on the mortgage market – and specifically the new build mortgage market, makes new housing supply even riskier than it would otherwise be and creates additional risks when weighing up investments.
Between 1999 and 2012, the government, often in partnership with house builders, unveiled equity loan schemes, share equity initiatives and mortgage guarantee schemes. These included the First-Time Buyers Initiative, HomeBuy Direct, FirstBuy and NewBuy alongside similar schemes with particular focuses like the Rent to HomeBuy and Social HomeBuy schemes.
These schemes varied in theme with several focusing on key workers, but broader based schemes such as Homebuy Direct had at their core a shared equity arrangement with developers and government sharing the upfront costs. These were relatively modest in scale and the upfront capital requirements (often 5% or more of the sales price) meant that for developers these initiatives were the preserve of those companies with sufficient balance sheets, usually the largest 25-35 builders.
Help to Buy inception
Announced at the 2013 Budget, by then Chancellor, George Osborne, the Help to Buy Equity Loan Scheme was established to accelerate the recovery of home building and improve the mortgage deposit and affordability prospects of first-time buyers following the Global Financial Crisis of the late 2000s.
By 2013, with few mortgage lenders offering Loan-to-Values on new build homes of more than 85% on houses and 80% on flats, investment in new housing schemes was minimal. With more than four in five home builders citing mortgage affordability and availability as a ‘major barrier’ to housing delivery, the scheme was designed to bridge the deposit gap for homebuyers while also improving affordability calculations for households applying for mortgages.
The three objectives of the scheme communicated by the Government at the time were:
Increase the supply of low-deposit mortgages for creditworthy households
Increase the supply of new housing
Contribute to economic growth
The scheme granted an equity loan worth up to 20% (40% in London from 2016 onwards) of the value of a new build home up to an initial maximum purchase price of £600,000 across England, whilst the buyer provided a deposit of at least 5% and a mortgage from a main lender of up to 75% (55% in London). The loan is interest free for five years, after which interest payments are due. The scheme’s final two years, from April 2021, became exclusive to first-time buyers and switched to regional price caps with greater emphasis on supporting purchasers in London and Southern England.
By the time the scheme formally closed down, it had supported 387,195 households, including 328,346 first-time buyer households, to buy new build homes.
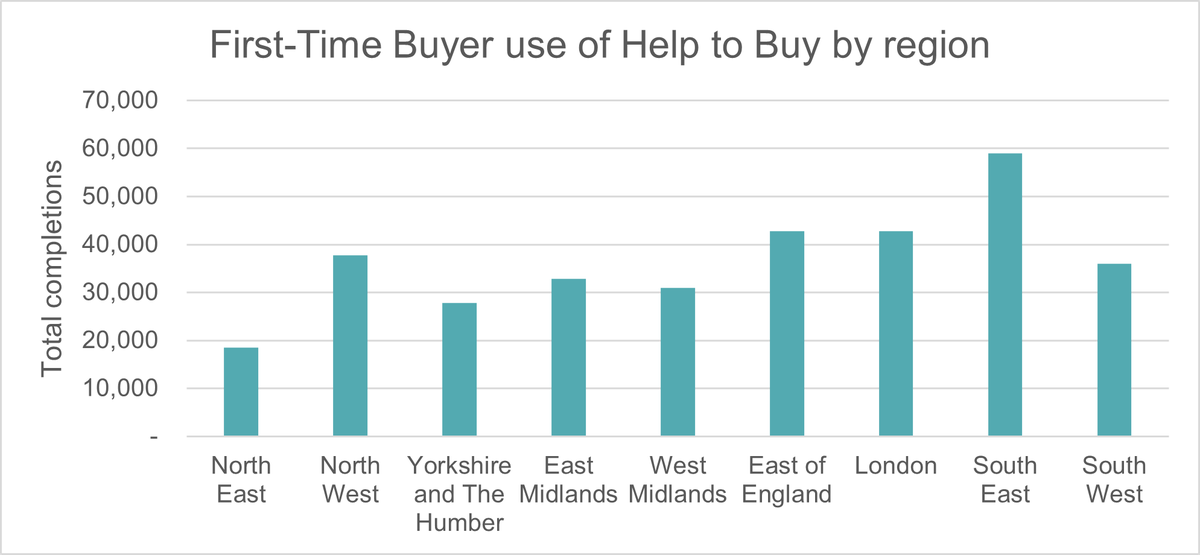
Help to Buy had broad appeal across all regions of England with no single region responsible for more than 18% of first-time buyer purchases through the scheme.
The 2021-23 Help to Buy scheme
At Budget 2018 the then Chancellor, Philip Hammond confirmed that the original version of the Help to Buy scheme would be replaced in 2021 by a two year initiative. The new 2021-23 Help to Buy scheme was characterised by (i) first-time buyer exclusivity and (ii) regional price caps ranging from £186,100 in the North East to £600,000 in London. The new price caps were based on a multiple of average FTB prices and introduced restrictive price caps in northern regions.
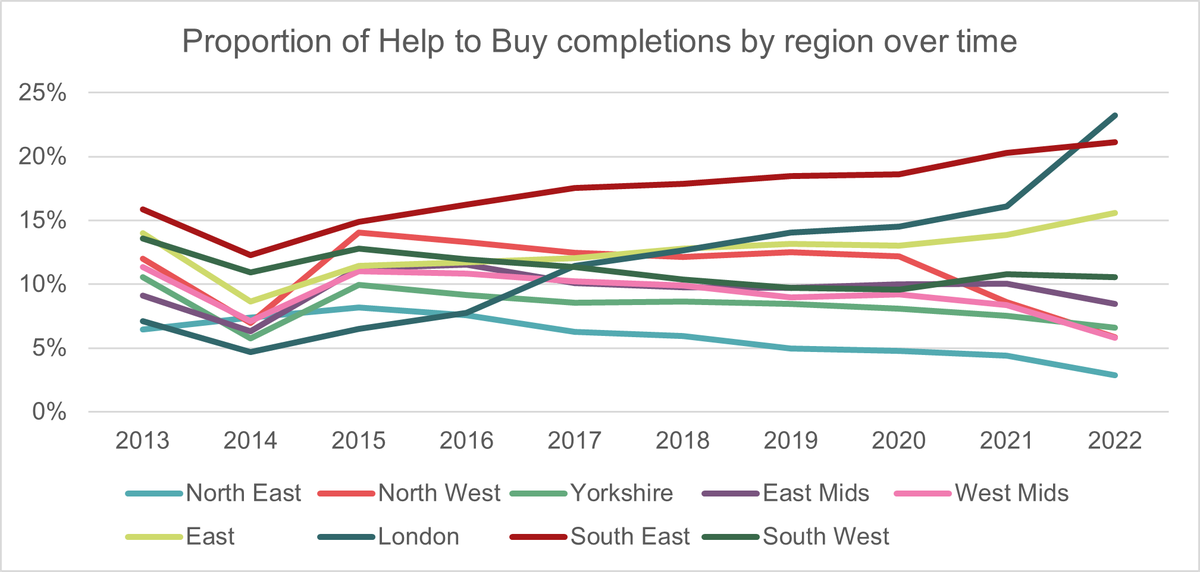
This tied in neatly with the prevailing Government and Homes England drive at the time to direct a greater proportion of housing investment in areas and regions where housing affordability was most stretched. The consequence has been a significant reduction in the proportion of Help to Buy completions recorded in Yorkshire, the North West and the North East. These three regions had accounted for 26% of all HtB transactions in 2019 but this had fallen to 15% by 2022. The proportion of HtB transactions across the two midlands regions fell from 19% in 2019 to 14% in 2022.
The chart below shows the changing regional split of HtB transactions over time. The initial rise in London from 2016 is accounted for by the then Chancellor, George Osborne’s decision to increase the maximum equity loan value in London from 20% to 40%.
Impact on supply
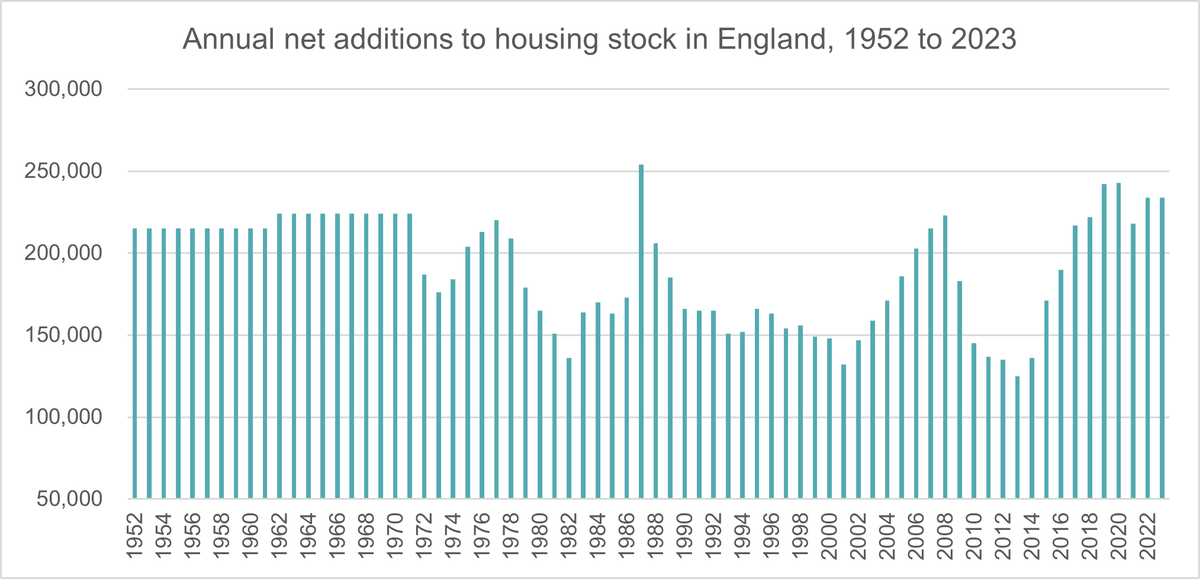
Although not exclusively attributable to the introduction of Help to Buy the impact of the scheme on housing supply in England is plain to see. By 2013, underlying economic indicators had already been going in the right direction for several years and (modest) growth in the economy had returned. However, housing supply had reached its peacetime nadir only in 2012/13 with 124,000 net additions recorded (136k gross). But despite the wider factors broadly tracking positively, homebuyers struggled to find affordable mortgage finance suitable for new build properties.
Critics of Help to Buy argued in the first couple of years of the scheme’s operation that it was having little impact on supply but by 2015 the additional confidence it had injected into the market and the strong forward visibility it created for builders, meant that land acquisition and investment in labour and skills eventually came to fruition.
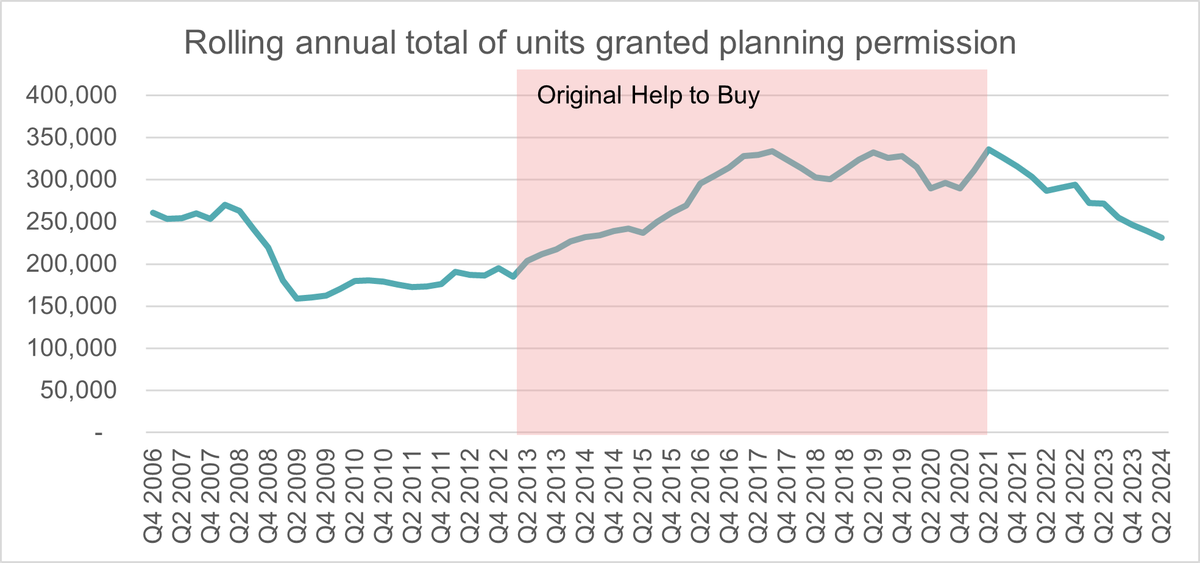
Planning permissions immediately started to increase as a result. Prior to the 2013 Budget, the number of units being approved in a 12-month period was around 185,000. By early 2015, this annualised figure exceeded 250,000. The trend continued throughout the first phase of the Help to Buy scheme, climbing to more than 330,000 at the peak – an 80% increase on the pre-Budget number.
By 2018, five years on from its introduction, housing supply in England had doubled. As sales increased, initially by around 40-50%, home builders who had taken a conservative approach to land acquisition and investment in preceding years found themselves building out their sites more quickly (where they could find adequate labour) and expanding their footprints. The combined effect of higher sales rates and more sales outlets drove what became the fastest increase in housing supply since the years after the Second World War.
In contrast with the period between 2008 and 2013, where mortgage availability for new build purchasers was frequently among the top barriers to delivery, almost immediately after the scheme was introduced, availability and cost of mortgage finance barely registered as a barrier to growth in home builder surveys.
The near doubling of housing supply in the five years after the scheme was unprecedented over the past 75 years. From the lowest housing output on record in 2012/13, the Help to Buy scheme, along with the reformed planning system, the National Planning Policy Framework, supported seven years of year-on-year increases in delivery to sustained levels of Net Housing Supply not seen in England since the Second World War. Although the 1950s and 1960s saw many more new homes built, the level of demolitions, often running at more than 50,000 per year was a considerable offset. The housing crisis of the postwar period was a very different one to today’s as it was far less about land availability and affordability and more about post-war rebuilding and renewal of housing stock.
Economic activity
The third objective set by the Government for the scheme was to generate economic activity. The home building industry is a major contributor to GDP and economic growth, and the increases in housing supply as a result of Help to Buy have supported this.
The 387,000 Help to Buy purchases supported:
- £86 billion generated in economic activity
- Over £10 billion in tax receipts
- More than 130,000 jobs supported each year at its peak
Return on HMG investment: Repayments of equity loans
Redemptions
While media and political discussion about Help to Buy often focuses on headline ‘costs’, such commentary, especially in contrasting it to Affordable Housing investment, usually fails to reflect the status of the Help to Buy intervention as an equity loan rather than grant spending.
Figures for Help to Buy redemptions are only published once per year as part of Homes England’s annual accounts and have never been actively publicised by Government. The latest redemptions report, covering the period up to end of March 2024, confirms that as of that date 154,275 equity loans had been fully paid off by homeowners. This represents 40% of all Help to Buy loans originated. This figure rises to more than 50% when considering only those Help to Buy equity loans that are more than four years old.
Loans taken out during the early phases of Help to Buy are now repaid. Of the 221,322 equity loans originated before 31 March 2019, 137,534 (62%) had been fully redeemed at 31 March 2024, including three-quarters of the earliest loans originated in 2013/14 to 2015/16.
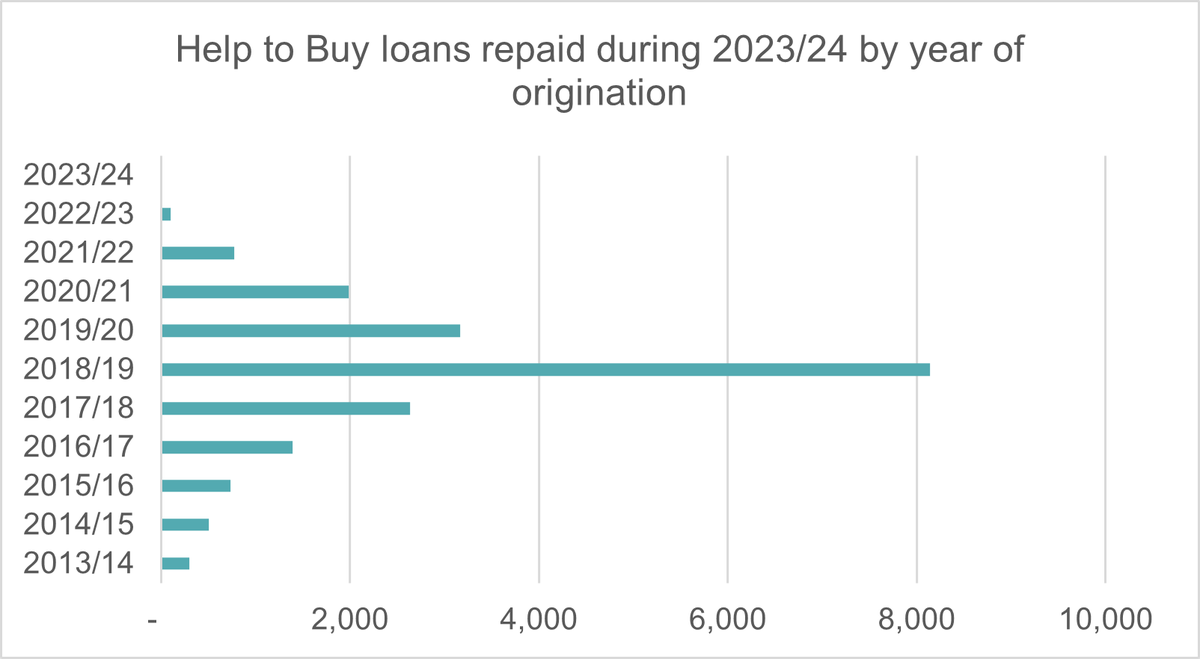
In the most recent period for which figures are available (the 12 months up to end of March 2024), just under 20,000 equity loans were repaid. This represented 5.1% of the entire loan book originated by HM Government through the scheme. Almost half of the loans repaid in the year were originated in 2018/19.
Loan redemptions in 2023/24 generated a return on investment of 4.6% compared with the original loan values involved representing a ‘profit’ of £59 million on those 19,728 loans, or around £3,000 per loan.
- The 19,728 equity loans repaid in 2023/24:
- Had an original loan value of £1.27bn (£64,260 per loan); but
- A redemption value of £1.33bn (£67,230 per loan).
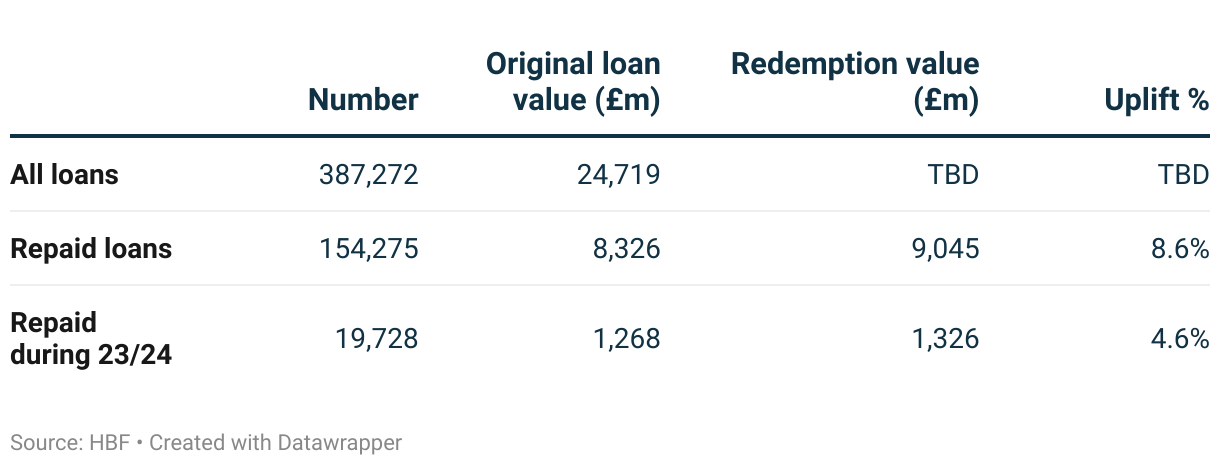
This takes the total uplift on redeemed loans to £718 million (+8.6% on original loan values), or around £4,650 per loan.
The 154,275 loans repaid to date:
- Had an original value of £8.33bn (£53,970 per loan); but
- A redemption value of £9.05bn (£58,630 per loan).
Across the lifetime of the Help to Buy scheme, equity loans with a total value of £24.7bn were originated to support 387,000 households into a new home meaning that by value, 34% of the loan book has been redeemed, but the redemptions to date have recouped 37% of the original investment.
Return on HMG investment: Interest income
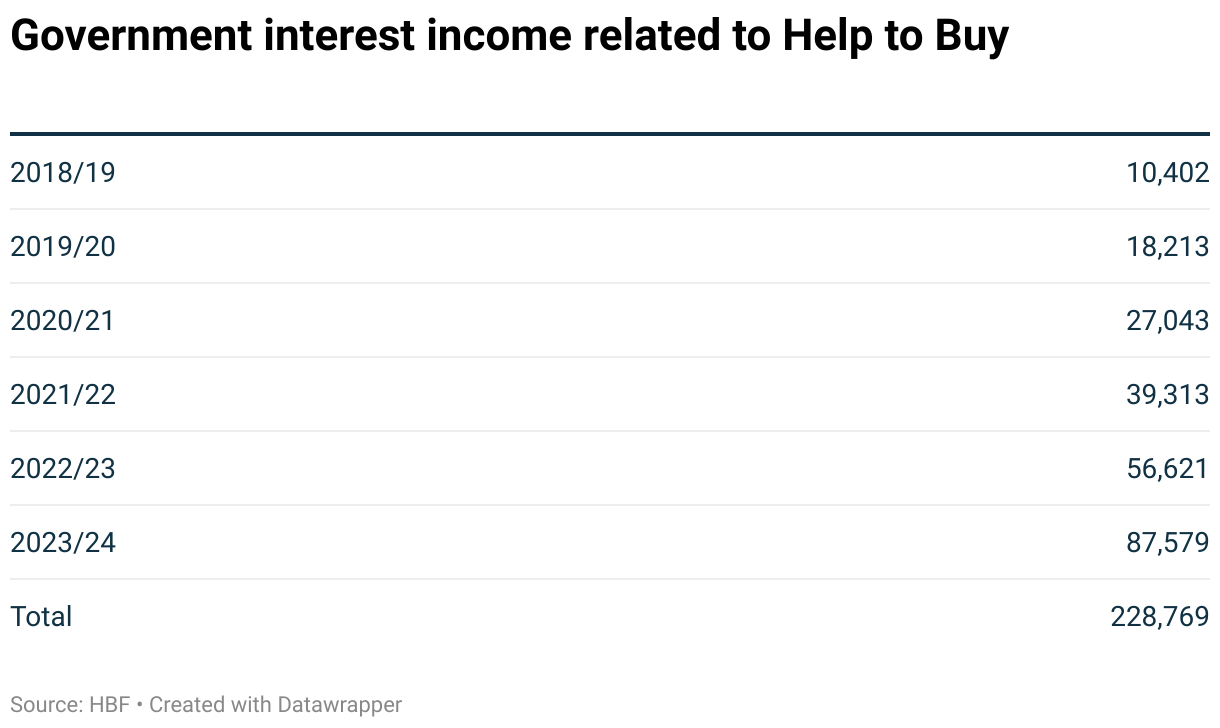
In addition to the returns on equity loans themselves, the Help to Buy book is now accruing growing interest payments. In total to date, the Exchequer has received more than £220m in interest income related to the scheme, including almost £90m in 2023/24.
Estimating the potential total return on investment for the Exchequer
Estimating the potential future and total return on the Exchequer’s investment in its Help to Buy loan book necessitates a degree of speculation given the sensitivity to property values. The Exchequer’s 4.6% return on loans repaid during 2023/24 represents a reduction on positive returns seen in previous years, bringing down the collective return to a still very healthy 8.6% (£718m). This is ignoring interest income to date and that which will come in future years.
With 34% of loans by value and 40% of loans by number fully repaid by March 2024 it is not unrealistic to assume that the overall book will generate a positive return by the time it is closed. Assuming an uplift in line with the total uplift on the 40% repaid to date, would see the Exchequer generate a ‘profit’ of £2.13bn across the entire book. In light of low – and even negative – house price inflation in the recent period, this could be considered an optimistic estimate. However, it is also worth noting that almost 33,000 properties purchased with Help to Buy equity loans before March 2017 (representing 27% from those first four years of the scheme’s operation) remain active and are likely to have seen increases in values.
If we assumed that the overall book would eventually come to reflect the most recent period, i.e. by taking the 2023/24 repayments as our guide with the 4.6% return on investment, then the total value of the Help to Buy loan book could be around £1.14bn higher than origination value.
Taking the mid-range point between the 2023/24 repayment experience and the entire repayment experience to date, and assuming a 6.6% overall increase in value, we could surmise that the book may eventually be closed down with a positive return to the Exchequer of £1.63bn.
Addressing Help to Buy criticism: inflationary?
A common criticism of Help to Buy has centred its impact on new build house prices. It is argued by some that the scheme results in new homes being overvalued.
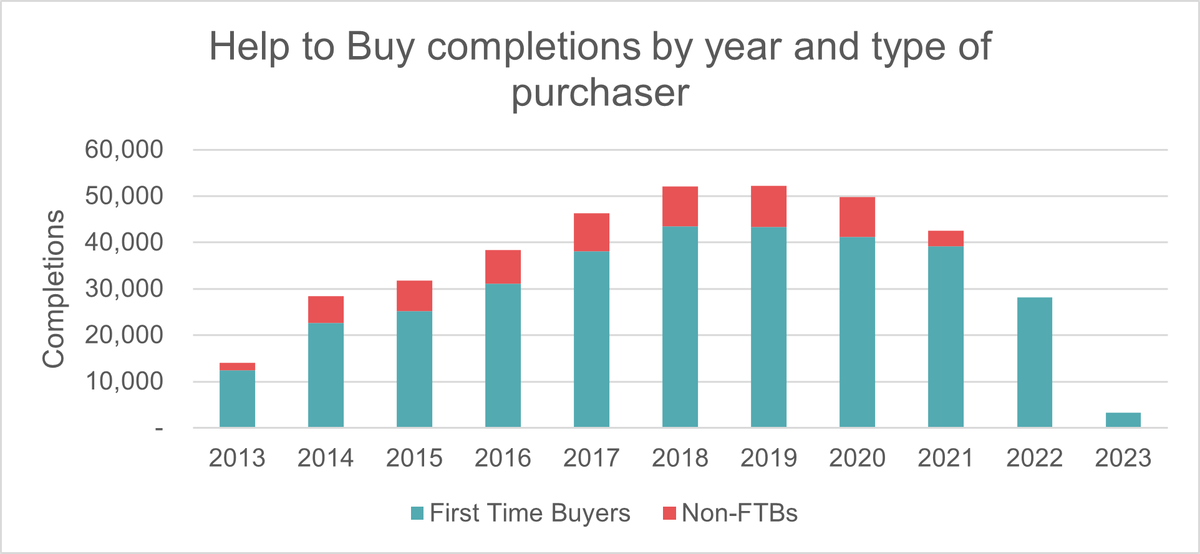
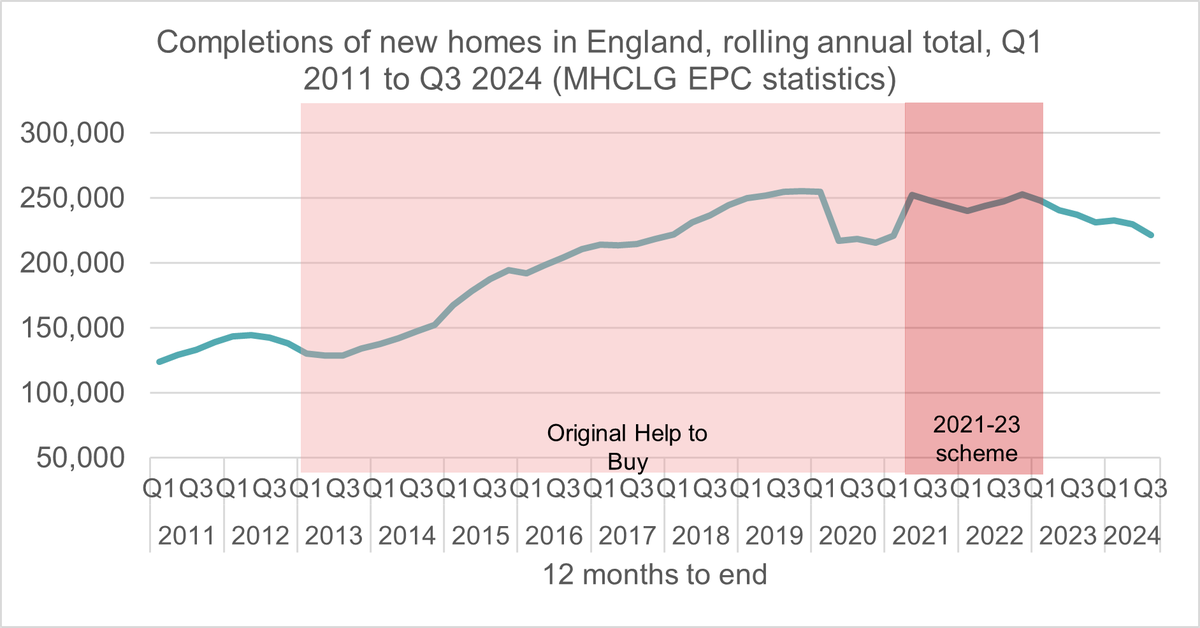
New homes represent a small fraction of the overall housing market and so new build house prices are driven by wider housing market dynamics and typically valuations on behalf of lenders ensure that new build prices are assessed according to local housing markets dominated by older properties. Help to Buy transactions peaked in 2018 and 2019. These were the final years in which the scheme was open to home movers as well as first-time buyers and before the introduction of regional price caps. In both years, just over 52,000 Help to Buy completions were recorded, coinciding with the highest number of new homes produced in England since the 1960s (250,000 in 2018/19 and 251,000 in 2019/20). Over this period, Help to Buy completions accounted for between 4.5% and 5.0% of all residential property transactions.
Even at these peaks, it seems implausible to argue that such a small subset of the housing market can be responsible for the house price inflation of the entire market, especially when the supply-side benefits of the scheme are factored in alongside the obvious demand-side drivers.
If the suggestion that Help to Buy was inflationary across the entire market feels unlikely, it is worth considering an argument that Help to Buy inflated new build prices specifically. For the reasons touched on above, it is important to have in mind how valuers assess new build homes on behalf of mortgage lenders and their customers. New build is valued according to local market dynamics. However, new homes with new fixtures, fittings and appliances and built to the very latest energy efficiency standards (and rising again as of 2022 before rising again in 2025), do generally cost more than second hand homes.
It is argued by critics that Help to Buy inflated new build prices. This argument comes in two forms. The first is that builders simply raised prices, stretching the ‘new build premium’ further than before. The second is that, because buyers had greater affordability as well as a lower deposit requirement, builders changed the type of new homes being built with a greater proportion of houses being built compared with flats.
The chart below, using paid price data from the Land Registry shows a strong correlation between prices in the new homes and existing homes markets even despite a much larger proportion of new homes comprising larger family homes in recent years compared with the early 2000s when around 50% of all new properties were flats.
Average new build prices between March 2013 (the month before the scheme was introduced) and December 2021, increased by 60.85%. By comparison, the average price of existing properties purchased in December 2021 was 60.77% higher than in March 2013.